EXECUTIVE SUMMARY
Microporosity is an important issue for composite manufacture. It can occur due to overcomplex part geometry, inappropriate material selection, or incorrect cure cycles. Although its primary effect is weakening the material, even if the overall porosity content remains below a level that causes a significant reduction in mechanical performance, its presence can mask the detection of other subsurface features. These can include critical defects such as disbonds and delaminations.
CFRP panels of varying porosity levels were manufactured with flat bottom holes to demonstrate the variation in their detectability. These flat bottom holes mimic the response from a disbond or delamination.
The signal strength at the reflector depth was seen to greatly reduce with porosity highlighting its effect in masking other features. To help ensure porosity content is low, porosity measurements can be taken with the dolphicam2. The dolphicam2 is suited to such measurements due to its 32 mm × 32 mm aperture consisting of 128 × 128 elements. This produces a high-resolution image and a vast amount of data that lends itself to statistical analysis.
FRP panels of varying porosity levels were manufactured with flat bottom holes to demonstrate the variation in their detectability. These flat bottom holes mimic the response from a disbond or delamination.
The signal strength at the reflector depth was seen to greatly reduce with porosity highlighting its effect in masking other features. To help ensure porosity content is low, porosity measurements can be taken with the dolphicam2. The dolphicam2 is suited to such measurements due to its 32 mm × 32 mm aperture consisting of 128 × 128 elements. This produces a high-resolution image and a vast amount of data that lends itself to statistical analysis.
INTRODUCTION
Distributed microporosity is an important issue for composite manufacture. It can weaken the material and cause a reduction in mechanical performance. Moreover, even if the overall porosity content remains below a threshold that causes a significant reduction in mechanical performance, its presence can mask the detection of other subsurface features and more critical defects such as disbonds and delaminations.
To demonstrate the variation in this detectability with porosity, CFRP panels of varying porosity levels were manufactured with flat bottom holes by Flying S Inc. for inspection with the dolphicam2. These flat bottom holes mimic the response from a disbond or delamination.
The CFRP panels are made from T700S plain weave carbon fiber prepreg, which is 42% epoxy resin by weight. Three panels were made, where curing was performed at three different vacuum levels (50%, 75%, and 100%). 100% vacuum represents the nominal cure cycle, with 75% and 50% vacuums used to intentionally introduce higher levels of porosity. Each panel is made to the same specifications otherwise and looks like the panel pictured in figure 1.
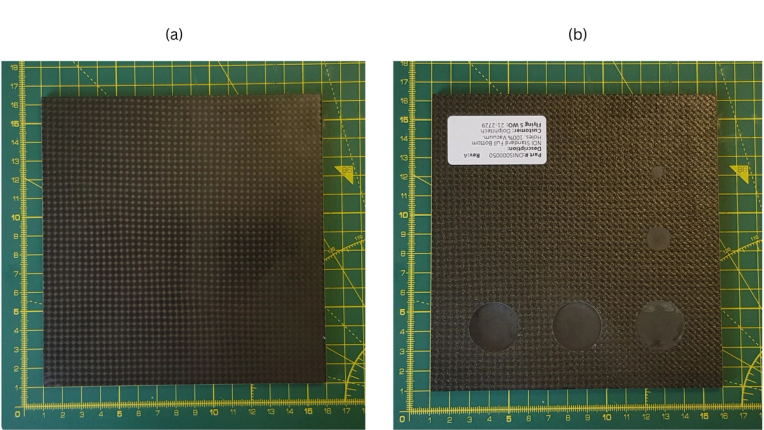
Figure 1. Photographs showing the appearance of the panels. The panel cured in a 100% vacuum is shown as an example. (a) shows the “inspection face” and (b) shows the “back face” of the panel.
Each panel has five flat bottom holes (FBH), which can be seen from the “back face” in figure 1. The dimensions of the FBH are shown in figure 2. The holes will be labeled using their nominal diameter and depth to the nearest millimeter in this study.

Figure 2. Technical drawing of the panel. Dimensions are given in millimeters.
With the variation in the detectability of defects with porosity, it is also important to identify panels with higher porosity. Accordingly, this study will cover both the variation in the detectability of defects with porosity and how to distinguish more porous samples.
SOLUTION
The panels were inspected using a dolphicam2+ with a TRM-BF-2.5MHz transducer module. This TRM has a central frequency of 2.5 MHz and an Aqualene delay line. It is suited to lower-grade composite material inspection, including materials with higher porosity levels.
A stitched map consisting of 5×5 tiles was acquired over the inspection face for each panel. Stitched maps are a unique capability enabled by dolphicam2’s live C-scans. They are formed by freehand positioning the transducer and stitching the data from each location together.
A standard ultrasonic gel was used as the couplant.
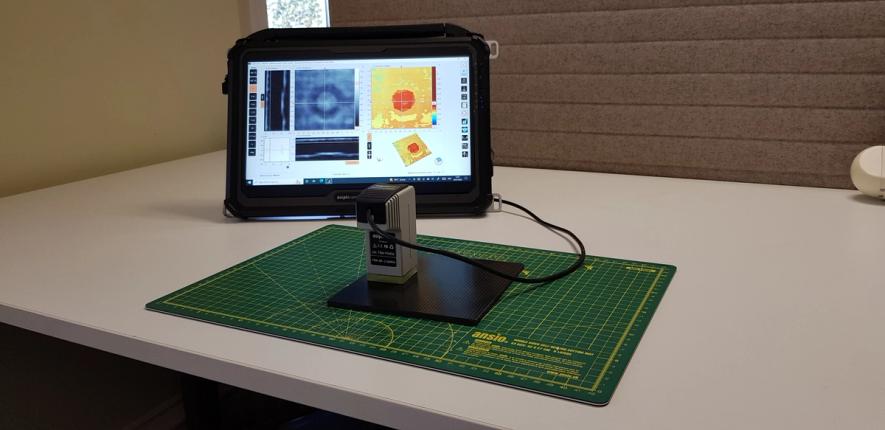
Figure 3. Photograph of setup on a panel using a dolphicam2+ and TRM-BF-2.5MHz transducer module.
As mentioned, this study will both cover the variation in the detectability of defects with porosity and how to distinguish more porous samples. The dolphicam2’s signal-to-reference tool will be used to quantify the difference between the desired signal and background level to show the variation in the detectability of the defects with porosity. The back wall amplitude is expected to reduce with porosity, which can be used as a quantitative means of distinguishing panels of different porosities. This is because the pores scatter the ultrasound as it travels through the material, so the quantity of sound energy received as an echo from the opposite surface of the material is reduced.
Values used in these calculations for the signal-to-reference and back wall amplitude are taken from the average of measurements over a larger region. Using data over a large area provides a more representative measurement and, as a result, increased confidence. This is particularly advantageous for anisotropic materials such as composites where point measurements may vary significantly over small areas. Our platform makes this straightforward as it can perform statistics on board and even on live data over its 128×128 element aperture, which makes for quick damage assessment.
We will also show how imaging and thresholding of the data can be used to visualize areas of higher porosity, where the area covered can be another quantitative indicator of the porosity of the sample.
CHALLENGES
The porosity content of the panels is higher when cured in a lower vacuum. This makes the material more attenuative and consequently, a lower frequency transducer is needed to penetrate the material. A 2.5 MHz transducer was chosen as a comprise between needing to penetrate the material and retaining the resolution needed to accurately image the defects.
FINDINGS
The signal-to-reference tool was used on the manually stitched data set with the data gated to contain the relevant reflector as shown in figure 4. The area that the reference value was calculated from was kept consistent, covering an area slightly over 3600 mm2 in size and with approximately 58,000 A-scans. The resulting signal-to-reference values are shown in figure 5.
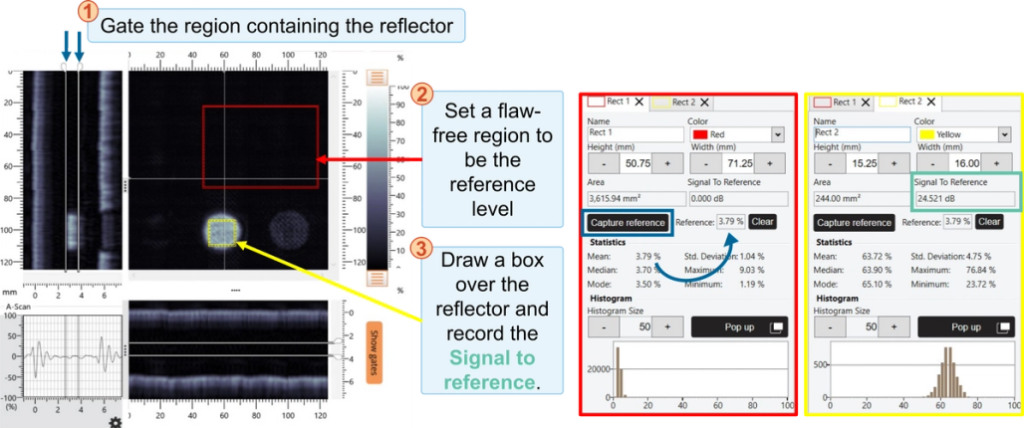
Figure 4. Process for calculating signal-to-reference for each reflector.
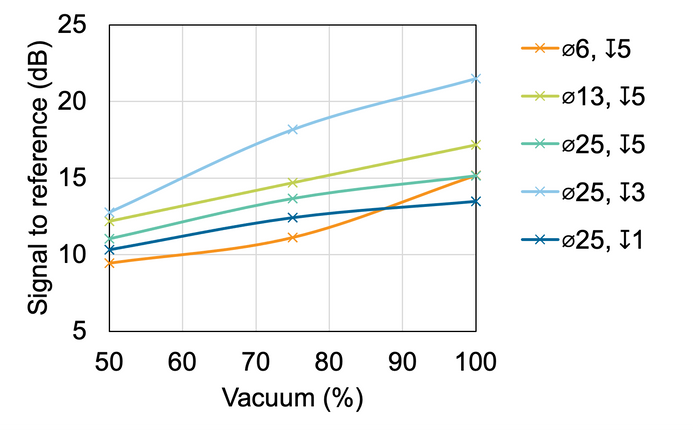
Figure 5. Signal-to-reference of reflectors. The reflectors are labeled using their nominal diameter and depth from the inspection surface to the nearest millimeter.
In figure 5, the signal-to-reference can be seen to reduce with lower vacuum levels, whereby the mean signal-to-reference for the 100% vacuum panel is 17.2 dB, compared to 14.4 dB and 11.4 dB for 75% and 50% vacuum panels respectively. The lower vacuum levels correspond to higher porosities, where the reduction in signal-to-reference is the result of porosity scattering the ultrasound, resulting in higher levels of noise and less signal from the defects themselves. It highlights the need to ensure porosity content is low to ensure defects are detected.
There are different ways of identifying panels with higher porosity. As discussed, one method is the reduction in back wall amplitude, as panels with higher porosity are expected to be more attenuative to ultrasound. The amplitude is taken over the same area as the reference region in figure 4, but with just the back wall gated. The results are shown in figure 6.
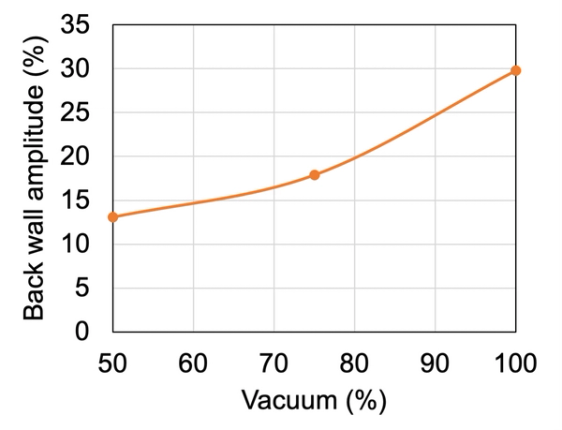
Figure 6. Back wall amplitude of panels cured in different vacuum levels.
In figure 6, the back wall amplitude reduces with reduced vacuum and thus higher porosity. This confirms that the back wall amplitude reduces with increased porosity level. The change is significant and thus the panels of different porosities can be clearly distinguished.
To visualize areas of higher porosity, the C-scan images can also be amplitude thresholded. Figure 7 shows the result for a 20% amplitude threshold using the Defect Detection tool in the dolphicam2 software. This approach can be used for quick pass/fail screening of composites, when the percentage amplitude that corresponds to an excessive level of porosity is known.
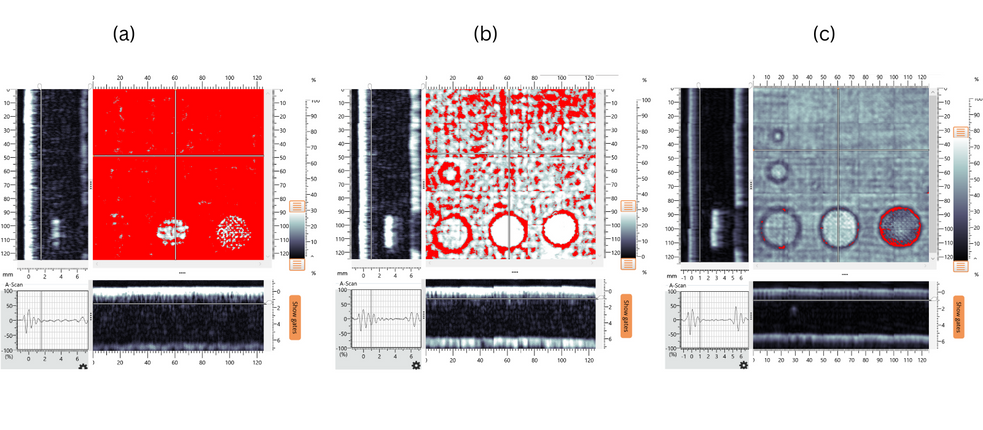
Figure 7. Amplitude view for manually stitched data on panels cured in (a) 50%, (b) 75% and (c) 100% vacuum.
The panels cured in a lower vacuum, to increase their porosity, have a larger area highlighted in red, which corresponds to larger areas of low amplitude. This can also be quantified with the fractional area plotted in figure 8. This is useful for procedures that stipulate a maximum allowable porosity by area fraction.
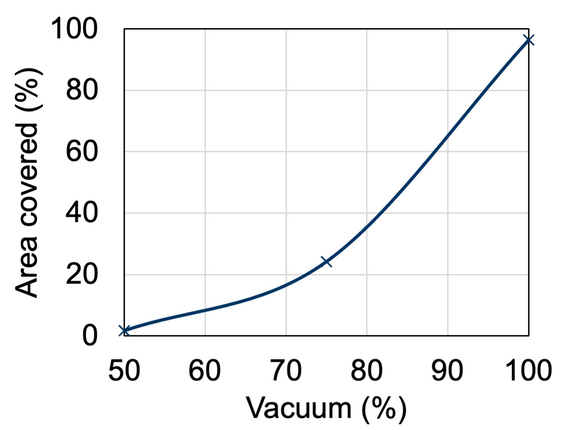
Figure 8. The area covered by the thresholded region for panels cured in different vacuum levels.
There may, however, be scenarios where defects need to be detected on more porous samples. Fortunately, the ability to detect the reflectors is better than what some of the signal-to-reference values may suggest. Figure 9 shows the manual stitch on the 50% vacuum panel, which represents the most porous and thus, most difficult to inspect panel. In figure 9, the thickness (ToF) view is shown with the back wall included in subfigure (a), and the ToF view is shown with internal gating and a threshold applied to help emphasize the flat bottom holes in subfigure (b).
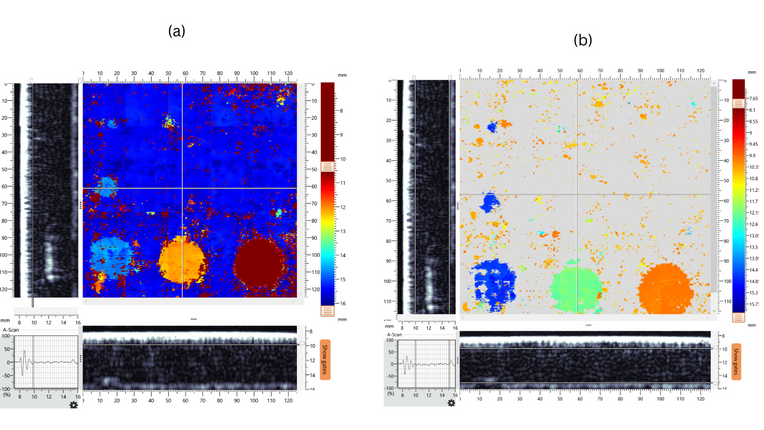
Figure 9. Thickness view of manual stitch taken on 50% vacuum panel. (a) shows the data with the back wall included, and (b) shows the data with internal gating and the amplitude threshold set to 12.5%.
All five of the flaws are clear to see in this thickness (ToF) view. Thus, the C-scans reduce the problem to one of pattern recognition, which humans are well suited to. This means that there is the possibility to detect defects in more porous samples, if necessary. This makes dolphicam2’s live C-scans very beneficial when compared to attempting the same task using only an A-scan display.
CONCLUSION
With its live C-scans and onboard statistical analysis, the dolphicam2 produces both detailed images and numerical data. The dolphicam2 is unique in being able to generate live C-scans from its 128×128 element aperture, which enables scans to be manually stitched. This allows for rapid mapping of data.
The dolphicam2 also has the functionality to perform statistics on board. With this, the defect signal strength could be quantified, whereby the signal-to-reference at the reflector depth was seen to greatly reduce with porosity. The mean signal-to-reference for the 100% vacuum panel is 17.2 dB, compared to 14.4 dB and 11.4 dB for 75% and 50% vacuum panels respectively, whereby a lower vacuum corresponds to a higher porosity. This highlights the need to ensure porosity content is low, highlighting the “dangers” of porosity in their ability to mask other subsurface features and more critical defects such as disbonds and delaminations. If defects do need to be detected and characterized in more porous samples, the dolphicam2 can generate C-scans with ease, facilitating interpretation compared to conventional A-scan displays.
For quantifying the porosity level itself, the average back wall amplitude can be monitored or the Defect Detection tool can be applied to the data, enabling rapid Pass/Fail quality control according to a variety of different criteria.

Dolphicam2+
Portable, rugged NDT system featuring the largest screen (14″) on the market, offering intuitive ultrasonic flaw detection with advanced imaging capabilities and rapid setup.
MAUT Core Units
TRM 2.5 MHz
The 2.5MHz transducer module (TRM) is well-suited to thicker section and lower grade composite material inspection.
MAUT Transducers (TRMs)
TRM 1.5 MHz
The 1.5MHz transducer module (TRM) is towards the lower end of our frequency range.
MAUT Transducers (TRMs)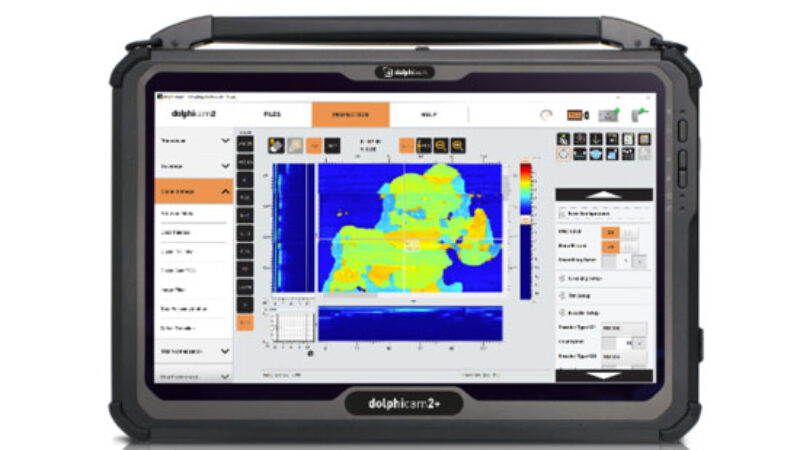
Dolphicam2+
Portable, rugged NDT system featuring the largest screen (14″) on the market, offering intuitive ultrasonic flaw detection with advanced imaging capabilities and rapid setup.
MAUT Core Units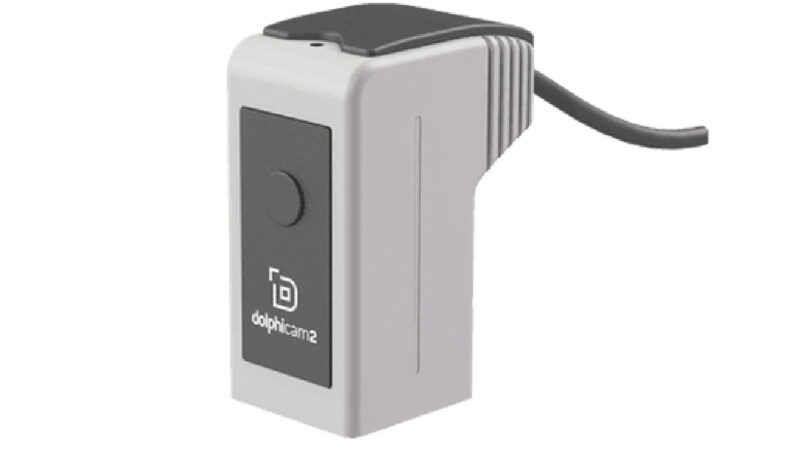
TRM 2.5 MHz
The 2.5MHz transducer module (TRM) is well-suited to thicker section and lower grade composite material inspection.
MAUT Transducers (TRMs)
TRM 1.5 MHz
The 1.5MHz transducer module (TRM) is towards the lower end of our frequency range.
MAUT Transducers (TRMs)REQUEST A QUOTE OR SUBMIT AN ENQUIRY
Need help with product information?
Get in touch with our experts for information or a quotation.