EXECUTIVE SUMMARY
Dolphitech were provided with a carbon steel corrosion calibration block to benchmark the performance of the dolphicam2 with the Odin software version. The block featured a range of defects representing general and pitting corrosion, over a depth range of 2-15mm. The dolphicam2 was able to successfully detect and characterise all defects, proving the performance of the equipment for this type of inspection.
INTRODUCTION
Carbon steel is the most widely used engineering material, offering a combination of high strength and relatively low cost. It is also very well-understood, with production processes and alloying elements refined over hundreds of years. One of its main drawbacks is its susceptibility to corrosion, which is estimated to cost $2.5tr annually, or 3.5% of global GDP.
Corrosion can occur in different forms under different environmental conditions, either as a general reduction in wall thickness due to material loss, or localised pitting normal to the surface. Accurate quantification of both forms of corrosion are vital to ensuring continued structural integrity of assets, and for assessing remaining service life. This quantification is possible with ultrasonic testing, however, is typically more difficult for pitting corrosion due to a lack of planar, reflective surfaces from which to obtain accurate thickness measurements.
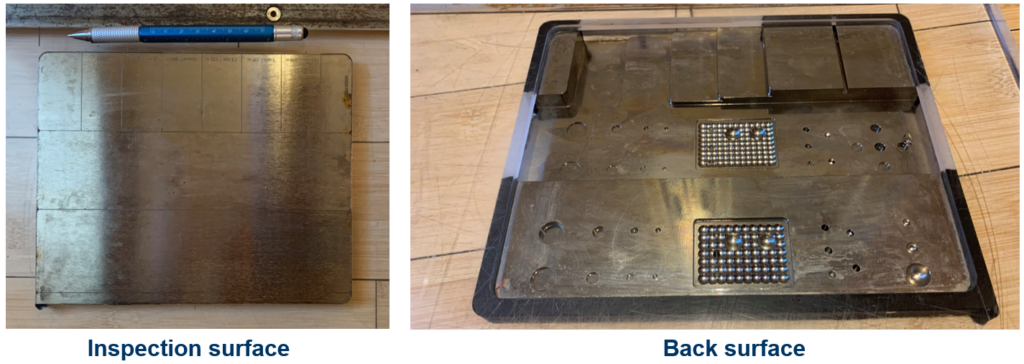
To assess the dolphicam2’s ability to inspect both general and pitting corrosion in carbon steel, a GE corrosion calibration block (PN 109M2542) was inspected. The block has a thickness range of 2-15mm, and includes artificial flaws with a diameter range of 2-10mm. Of particular note are the regions with an undulating circular pattern milled into the back surface, with additional local features introduced within these regions to simulate pitting corrosion.
SOLUTION
The block was inspected using a TRM-DB-8MHz Transducer Module (TRM). This TRM is towards the higher end of our frequency range and therefore provides good sensitivity for inspection for small features in metals. The 8mm Rexolite delay line provides a wear-resistant, hard contact surface, suitable for smooth, flat components.
The sample was inspected using a manual stitching technique, whereby the transducer is moved sequentially over the surface of the part, with data acquired at each location. Data was collected as an “FMC (Full Matrix Capture) Stitch”, meaning that all waveform data was collected and stored in addition to the C-scan images. Regions of pitting corrosion were further investigated using the Total Focusing Method (TFM). This is a synthetic focusing algorithm that can improve image resolution in isotropic materials such as steel. In the dolphicam2 software it is applied to the two B-scans. For more information and to see TFM in action please see here.
In the dolphicam2 software, data is automatically measured and displayed as both amplitude C-scans and Time of Flight (ToF) C-scans. In the images shown below, amplitude C-scans are displayed in greyscale, with black to white corresponding to increasing signal amplitude. ToF C-scans are displayed with a rainbow colour palette, with red to blue corresponding to increasing material thickness. Standard ultrasonic gel was used as a coupling agent.
CHALLENGES
The inspection was challenging for two reasons. First, the large thickness range means that specifying a single setup that can identify and accurately characterise all of the features can be difficult. Nevertheless, this can be achieved with precise B-scan gating and correct Time Corrected Gain (TCG) definition. Second, the simulated pitting corrosion within the textured back wall region presents no clear reflective surface, and thus C-scan characterisation is limited. In such regions, application of TFM can be used to improve both through-wall and in-plane resolution.
FINDINGS
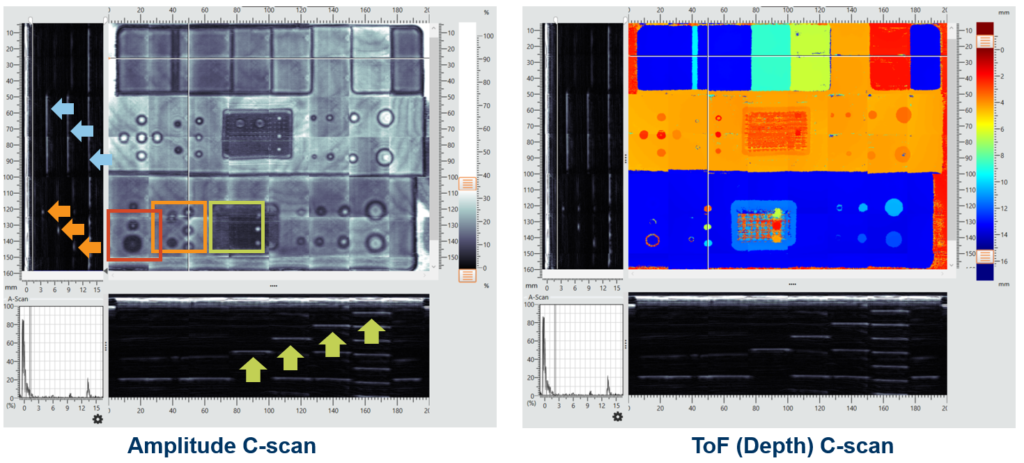
All features were successfully detected and characterised with the dolphicam2. Shown below is the full FMC stitch of the block. This C-scan map covers an area of 200x175mm, which, with the 0.25mm element pitch, represents the data from 560,000 A-scans. Both amplitude (left) and ToF (right) views use the same data and the user can thus toggle between them as needed. As the data is an FMC stitch, the user can move the crosshairs over the C-scan area and view the corresponding B-scans and A-scan. In the vertical B-scan, the repeat defects from the 5mm thick middle strip are apparent (blue arrows). The defects from the 3mm diameter flat bottomed holes in the 15mm step are also visible in this vertical B-scan (orange arrows) at depths of ~4mm, ~7.5mm and ~11.5mm. In the horizontal B-scan, the steps at depths of 2.5mm, 5mm, 7.5mm and 10mm are all easily resolved (green arrows), including their repeat defects.
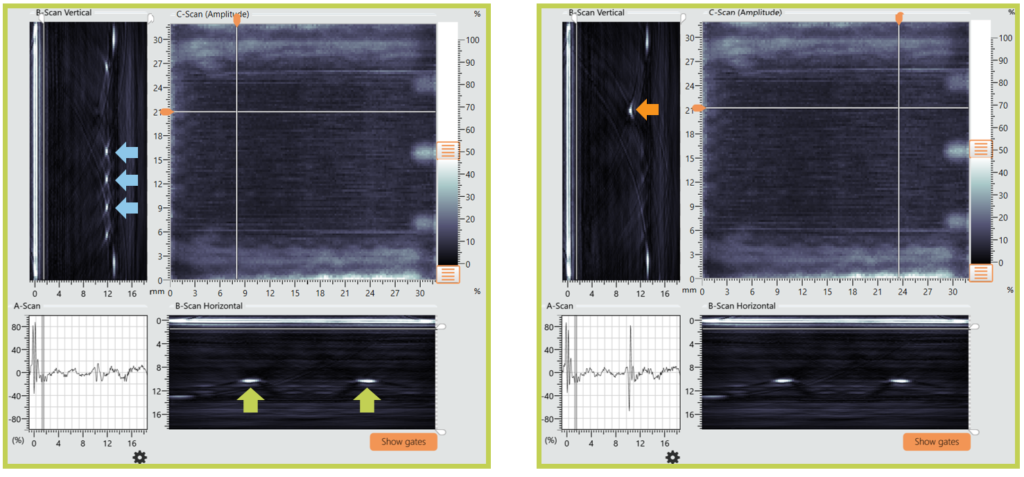
Shown below are single acquisition views from the 15mm step taken at the location of the green square in the FMC Stitch C-scan above. In the Amplitude C-scans, corrosion can be detected due to the absence of a back wall echo. However, no corresponding ToF C-scan information exists to measure its severity due to the lack of planar, reflective surfaces. With TFM applied to the B-scans however, several point reflectors can be resolved, giving the required through-wall information. These include the regular pattern of round bottomed holes with an apex at a depth of 12mm in the Vertical B-scan (blue arrows) and two larger round bottomed holes with an apex at a depth of 10mm (green arrows). These correspond to wall thickness losses of 3mm and 5mm respectively. Using the same C-scan, but moving the crosshairs to a different location and recalculating the TFM shows one of these round bottomed holes in the Vertical B-scan as well as the Horizontal B-scan (orange arrow).
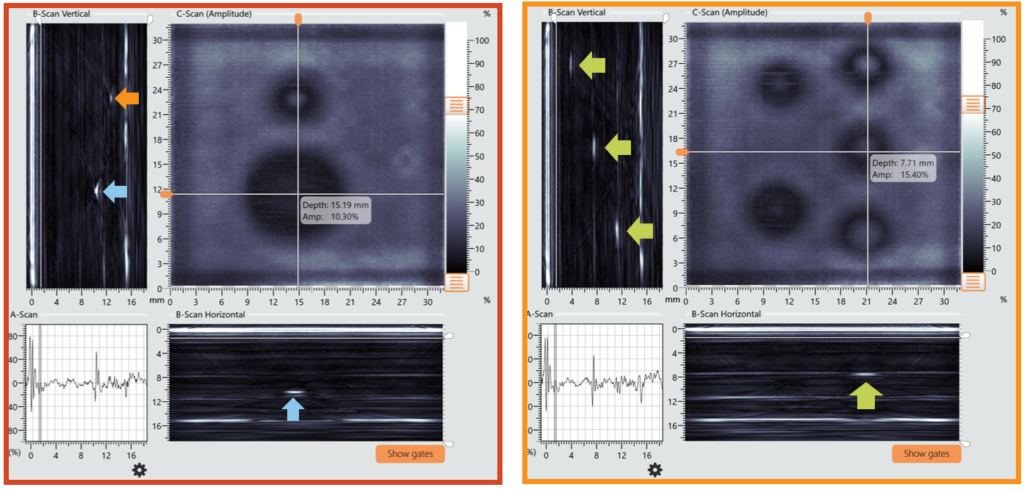
Shown below are additional single acquisition views at the 15mm step taken at the locations of the red square (left hand image below) and orange square (right hand image below) in the FMC Stitch C-scan above. Again, through application of TFM, the large round bottomed hole is observed to have an apex at a depth of 10mm (blue arrow) corresponding to a wall thickness loss of 5mm. The smaller round bottomed hole is observed to have an apex at a depth of 13mm (orange arrow) corresponding to a wall thickness loss of 2mm. The three flat bottomed holes, with well-defined edges enabled by TFM, are observed at depths of 4mm, 7.5mm and 11.5mm (green arrows).
CONCLUSION
The dolphicam2 with a TRM-DB-8MHz was able to successfully detect and characterise all defects within the block. The Total Focusing Method (TFM) was used for pitting corrosion features, which, although detectable in the C-scan images, might not be easy to characterise. For such defects, the application of TFM in the two B-scan images provides quick characterisation of pitting depth and minimum remaining wall thickness. This in turn can be used for rapid accept/reject decision making, and for remaining life estimation.

TRM 8 MHz
The 8MHz transducer module (TRM) is a great choice for a wide range of metallic applications.
Transducers (TRMs)
Dolphicam2
Pelicase includes a 10” rugged tablet, Black Box and cables for the dolphicam2
Core Units
Dolphicam2+
Pelicase includes a 14” rugged tablet, Black Box and cables for the dolphicam2+
Core Units
TRM 8 MHz
The 8MHz transducer module (TRM) is a great choice for a wide range of metallic applications.
Transducers (TRMs)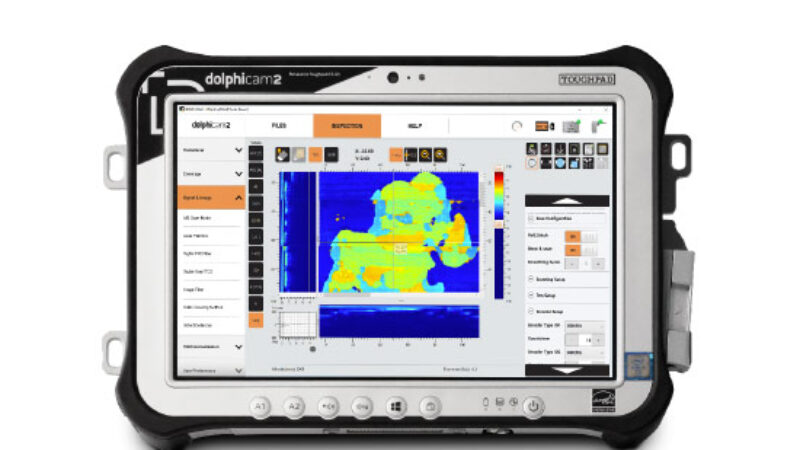
Dolphicam2
Pelicase includes a 10” rugged tablet, Black Box and cables for the dolphicam2
Core Units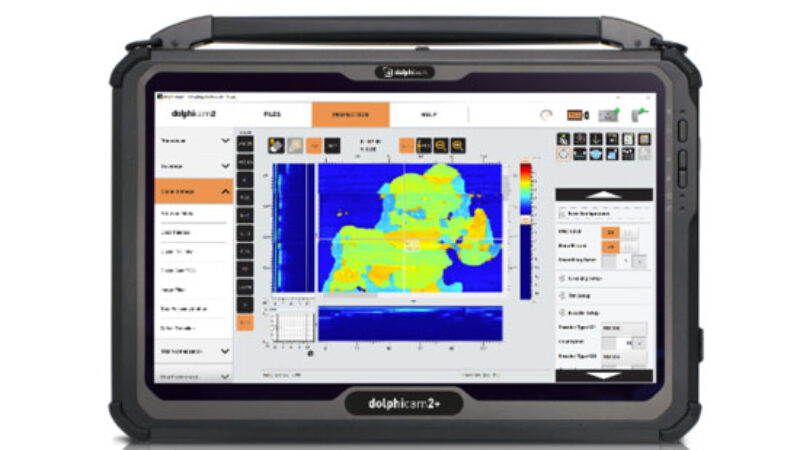
Dolphicam2+
Pelicase includes a 14” rugged tablet, Black Box and cables for the dolphicam2+
Core UnitsENERGY MARKET
In the harshest environments onshore and offshore, dolphitech provides a safe and adaptable non-destructive testing platform to the Energy Industry.
Read moreREQUEST A QUOTE OR SUBMIT AN ENQUIRY
Need help with product information?
Get in touch with our experts for information or a quotation.