INTRODUCTION
A CFRP panel made to simulate the specification of a Federal Aviation Administration (FAA) NDI Proficiency specimen 1C.
This panel features various manufacturing flaws typical of aerospace composites, and as such, is used to assess the performance of both NDT equipment and personnel. The panel is a 64 ply co-cured substructure (32-ply main laminate with 32-ply bonded stiffener substructure and a 32-ply tapered, bonded laminate). This corresponds to a nominal thickness over the majority of the panel of ~0.240″ with a maximum thickness of ~0.480″ over the bonded stiffener substructure and tapered bonded laminate. The stiffener substructure will subsequently be referred to as the substructure, and the tapered bonded laminate as the taper. The panel is 24″×18″ and the flaws present include Carbospheres, pillow inserts, grinding disk cut, flat bottom holes, left-in prepreg backing, adhesive backing, grease, Grafoil, and sealant. Photographs of both sides of the panel are shown in Figure 1.
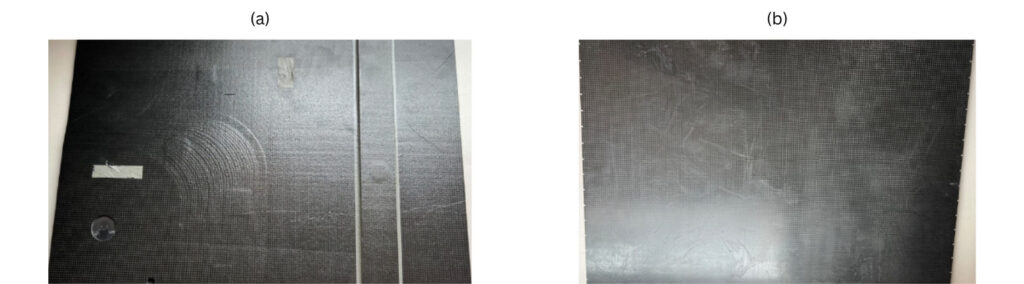
Figure 1. a) Photograph of the bottom face of the panel showing the ply build ups. b) Photograph of the top face of the panel (the “inspection side”).
The nominal locations of the manufactured flaws are shown in Figure 2. The labeled numbers in the figure correspond to the item numbers in Table 1. Figure 2 shows the panel from two orientations; it shows the face pictured in Figure 1a from the same orientation, and underneath this, a side profile of the panel. Further dimensions and details of flaws introduced into the panel are given in Figure 3.
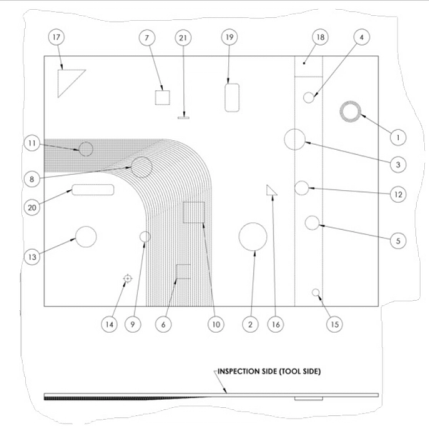
Figure 2. Technical drawing showing main features on the panel in their nominal locations.
Table 1. Nominal dimensions of panel features.

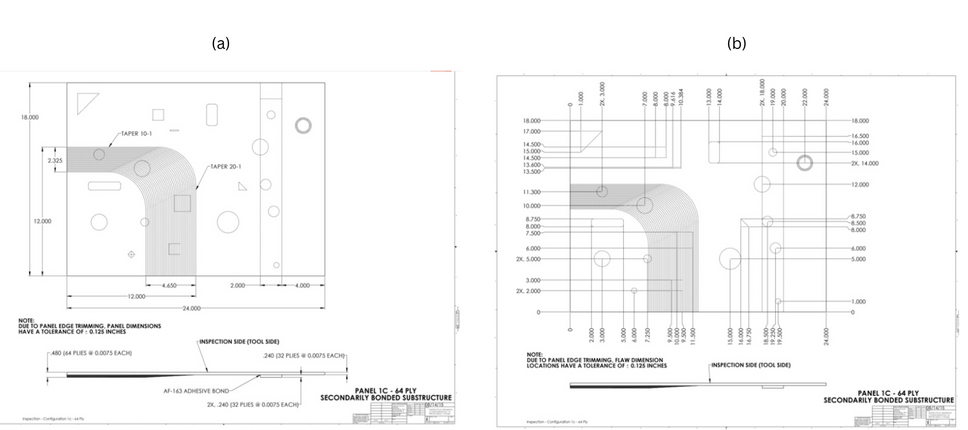
Figure 3. Technical drawings for the specification of the panel.
METHODOLOGY
The panel was inspected using a dolphicam2+ and a TRM-BF-2.5MHz Transducer Module (TRM).
This TRM is our mid-low range frequency model, capable of penetrating the ~0.480″ maximum thickness of the panel reliably while still providing excellent resolution of flaws. Also, a factor in choosing this TRM is the attenuative properties of the paste adhesive applied. Deionized water was used as a couplant to provide optimal sound transmission.
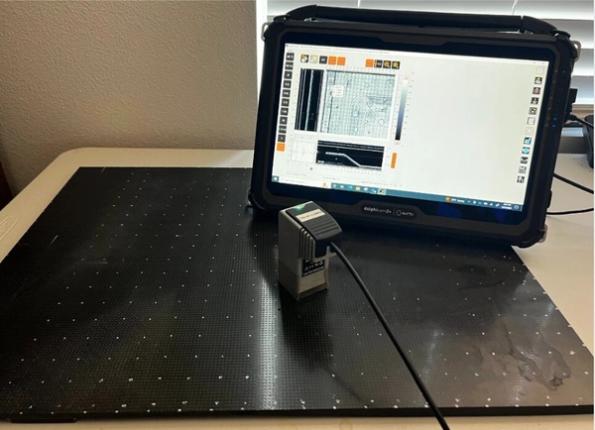
Figure 4. Photograph of dolphicam2+ with TRM-AF-3.5MHz transducer on panel.
The flaws were located by mapping out a 17.717″ × 19.685″ of the panel and obtaining a Full Matrix Capture (FMC) stitched C-Scan image over the entire panel and monitoring the software display. FMC implies that all A-scan and B-scan data was captured and recorded in addition to the C-scan image. Additionally, a combination of single C-scans and manually stitched C-scans were acquired where the flaws were located. With the dolphicam2+, the amplitude (AMP) and time of flight (TOF) data are acquired simultaneously. In this study, a DAC/TCG curve was applied to normalize amplitude signal response to ~80% over the mapped images. The amplitude and time of flight data are plotted in the bone and jet color palettes respectively, and the dimensions are set to inches to be consistent with the panel specifications.
FINDINGS
Figure 5. shows the approximate observed locations of the identified flaws overlaid on a photograph of the panel showing the nominal locations of the flaws.
The acquired C-scans themselves are shown in Figures 7 to 25. Item 1 (Impact) was not completed by the manufacturer, therefore there are no readings to report. Item 5 was not placed to drawing specifications. The actual location of the flaw is detailed in Figure 10.
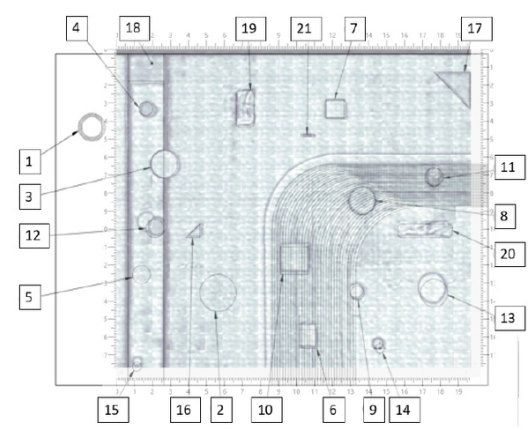
Figure 5. Overlay of the manually-stitched Amplitude C-scan and the defect placement technical drawing.
Figure 6. shows the corresponding FMC Stitched image in AMP and TOF of the inspection area:
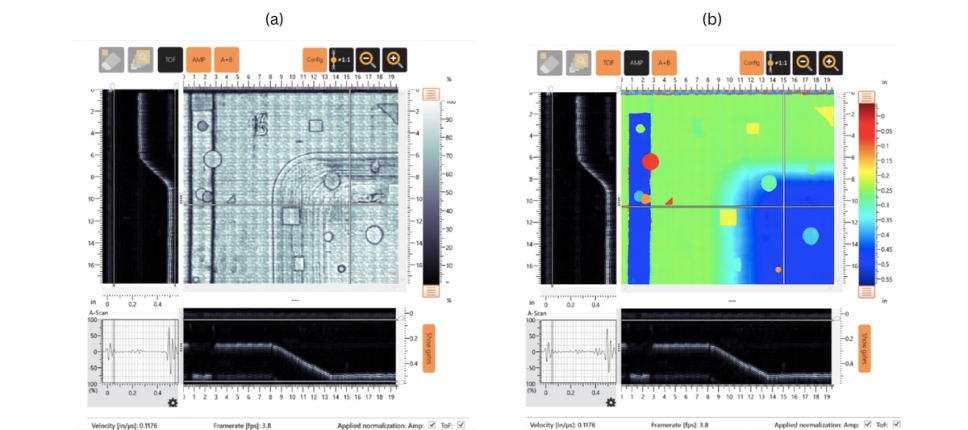
Figure 6. a) Amplitude FMC stitched Image b) Time of Flight FMC Stitched Image.
Each item will be discussed in turn, and the dimensions of the flaws measured using the defect detection tool from these scans will be noted, with all measurements summarized in Table 2. Areas outside of the thresholds set will be annotated in a “Red” color palette.
Figure 7. shows Item #2, Carbospheres which are embedded at 50% ply thickness of the 32-ply main laminate. Due to the similar acoustic properties of the Carbopheres and the composite structure, there is little reflected signal amplitude to the TRM as most of the sound transmits through the flaw. Amplitude (AMP) and Time of Flight (TOF) gate settings were adjusted to monitor the interior structure, revealing the presence of the flaw. Manually stitched FMC C-Scans (AMP) reveal the flaw sized with an area of 3.248in², measured using the thresholds set in the Defect Detection software.
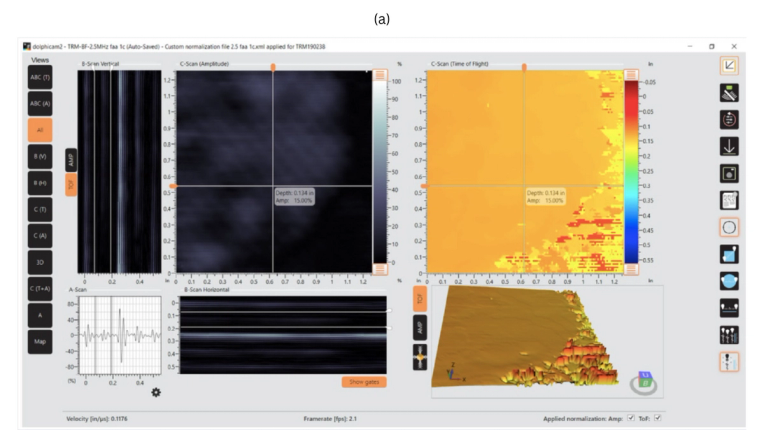
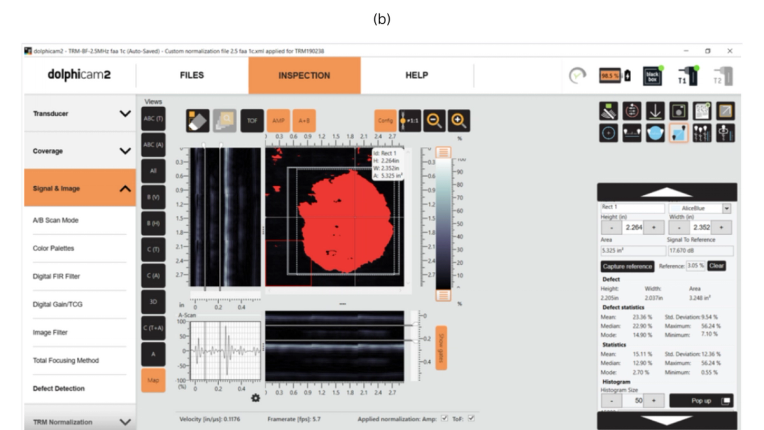
Figure 7. a) All View of Item #2 Carbospheres which are embedded at 50% ply thickness of the 32-ply structure b) The corresponding manually stitched FMC C-scan (AMP) of Item #2 with a Defect Detection Threshold applied.
Figure 8. details Item #3, a pillow insert embedded at 25% thickness of the 32-ply structure that extends over the substructure. The green regions of the TOF view represent the 32-ply main laminate, while the blue regions represent the backwall of the substructure. The dark orange region represents the pillow insert. Manually-stitched FMC C-Scans (AMP & TOF) reveal the flaw sized with an area of 1.969in², measured using the thresholds set in the Defect Detection software.

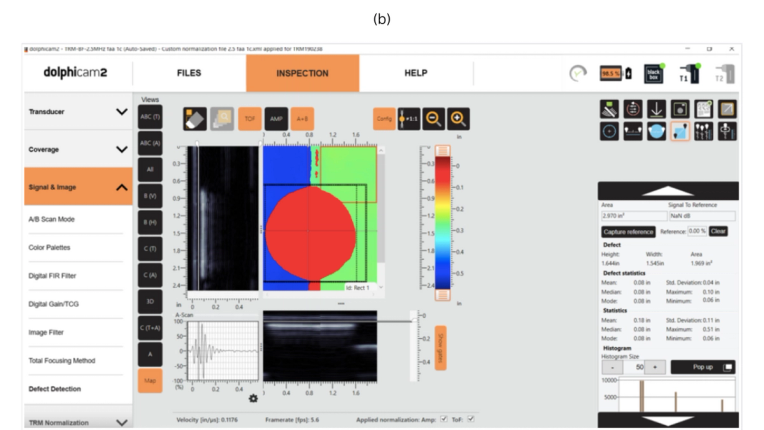
Figure 8. a) All View single capture of Item #3 a pillow insert embedded at 25% thickness of the 32-ply structure that extends over the bonded substructure. b) Corresponding manually-stitched FMC C-Scan (TOF) of Item #3 with Defect Detection activated.
Figure 9. details Item #4, a pillow insert, embedded into the bondline, between ply 32 and the adhesive of the substructure. The green circle in the TOF view represents Item #4, while the blue regions surrounding represent the backwall of the substructure. Using dolphitech’s Defect Detection feature in TOF view reveals the flaw encompasses an area of 0.664in².


Figure 9. a) All view single capture screenshot of Item #4 a pillow insert, embedded into the bondline, between ply 32 and the adhesive of the substructure. b) The corresponding C-Scan (TOF) of Item #4 with Defect Detection activated.
Figure 10. details Item #5, a pillow insert embedded between ply 16 and 17 of the substructure. This defect was misplaced during the manufacturing process and is located beneath item 12. The light blue circle in the TOF view represents Item #5. The dark blue region represents the backwall of the secondarily bonded substructure while the orange region is item 12. Using dolphitech’s Defect Detection feature in TOF view reveals the flaw encompasses an area of 0.726in² due to the misplacement.
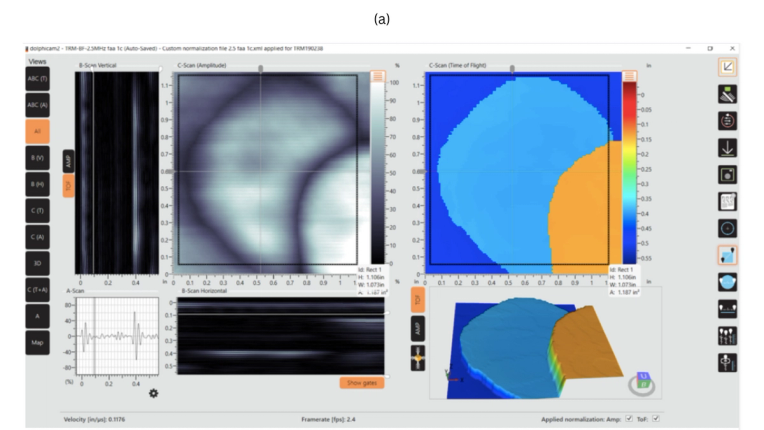
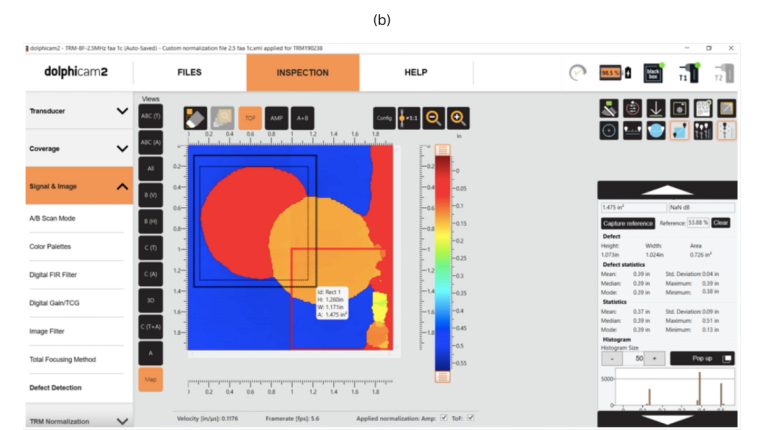
Figure 10. a) All view screenshot of Item #5 a pillow insert embedded between ply 16 and 17 of the substructure. b) The corresponding manually-stitched FMC C-Scan (TOF) of Item #5 with Defect Detection activated.
Figure 11. details Item #6, a pillow insert embedded in the taper between ply 10 & 11. The turquoise region in the TOF view represents Item #6. The transition from a darker blue region to a lighter blue region represents the slope of the backwall into the taper. Using dolphitech’s Defect Detection feature in TOF view reveals the flaw encompasses an area of 1.181in².
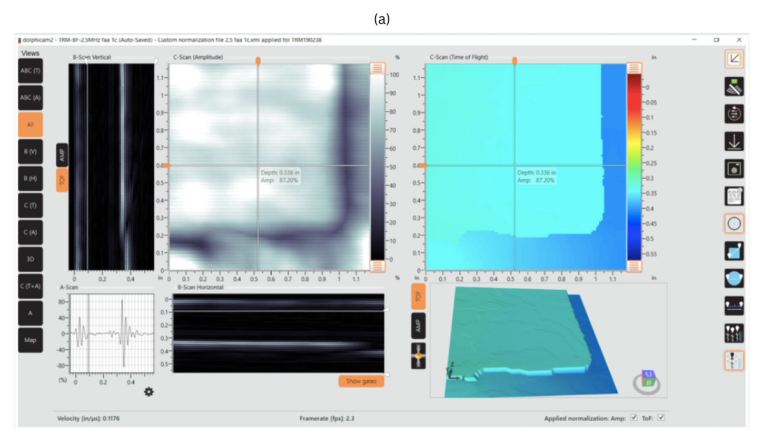
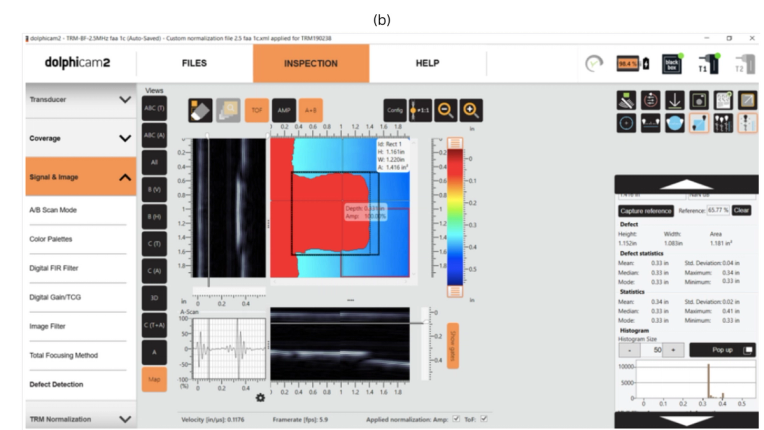
Figure 11. a) All view screenshot of Item #6 a pillow insert embedded in the taper between ply 10 & 11. b) Corresponding manually-stitched FMC C-Scan (TOF) of Item #6 with Defect Detection activated.
Figure 12. details Item #7, a pillow insert embedded between ply 24 & 25 of the main laminate. The yellow region in the TOF view represents Item #7. The green area surrounding Item #7 represents the backwall. Using Dolphitech’s Defect Detection feature in TOF view reveals the flaw encompasses an area of 1.354in².

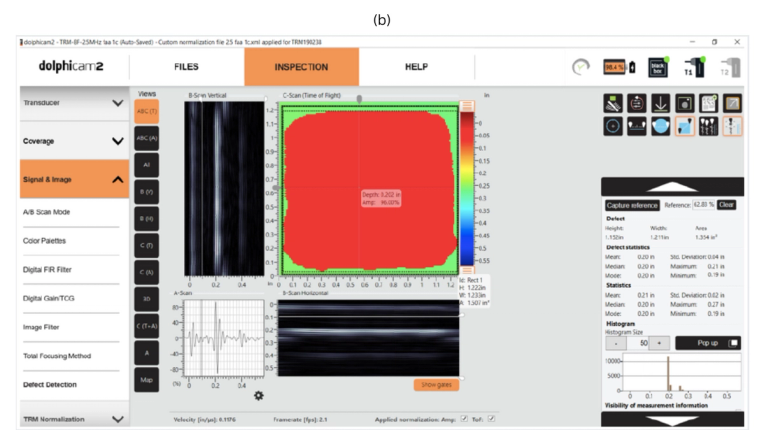
Figure 12. a) All view screenshot of Item #7 a pillow insert embedded between ply 24 & 25 of the main laminate. b) The corresponding C-Scan (TOF) of Item #7 with Defect Detection activated.
Figure 13. details Item #8, a pillow insert embedded at the interface between ply 4 and 5 of the taper. The green region in the TOF view represents Item #8. The transition from light blue to dark blue is due to the slope in the backwall of the taper. Using dolphitech’s Defect Detection feature in TOF view reveals the flaw encompasses an area of 2.140in².
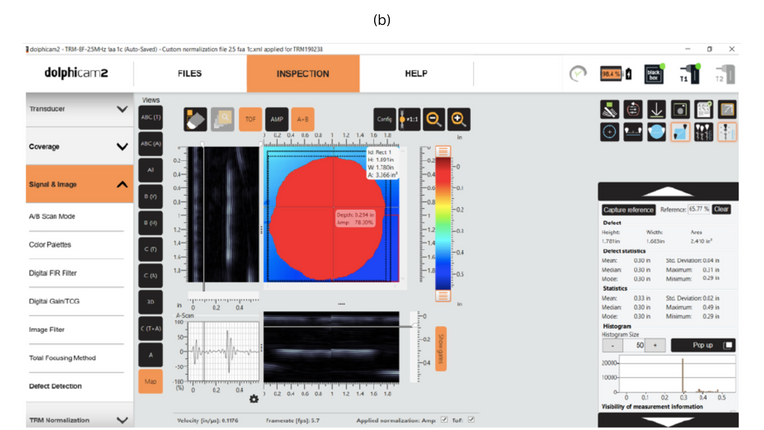
Figure 13. a) All view screenshot of Item #8 a pillow insert embedded between ply 4 and 5 of the taper. b) The corresponding manually-stitched FMC C-Scan (TOF) of Item #8 with Defect Detection activated.
Figure 14. details Item #9, a pillow insert embedded at the interface between ply 26 and 27 of the taper. The lighter blue region in the TOF view represents Item #9. The dark blue region is the backwall of the taper. Using dolphitech’s Defect Detection feature in TOF view reveals the flaw encompasses an area of 0.502in².
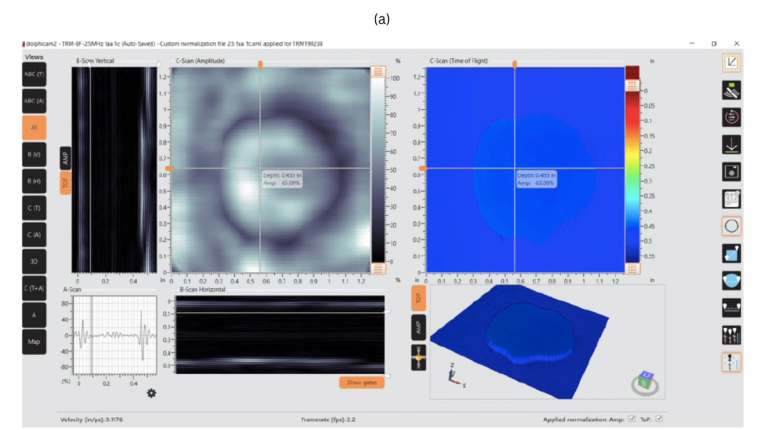
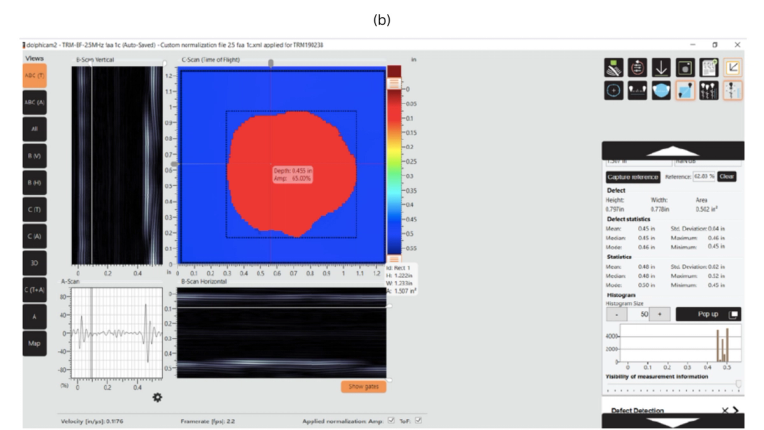
Figure 14. a) All view screenshot of Item #9 a pillow insert embedded at the interface between ply 26 and 27 of the taper. b) The corresponding manually-stitched FMC C-Scan (TOF) of Item #9 with Defect Detection activated.
Figure 15. details Item #10, a pillow insert embedded at the interface between ply 24 and 25 of the main laminate over the taper region. The yellow region in the TOF view represents Item #10. The dark blue region transitioning to a green is the backwall of the taper. Using dolphitech’s Defect Detection feature in TOF view reveals the flaw encompasses an area of 2.235in².
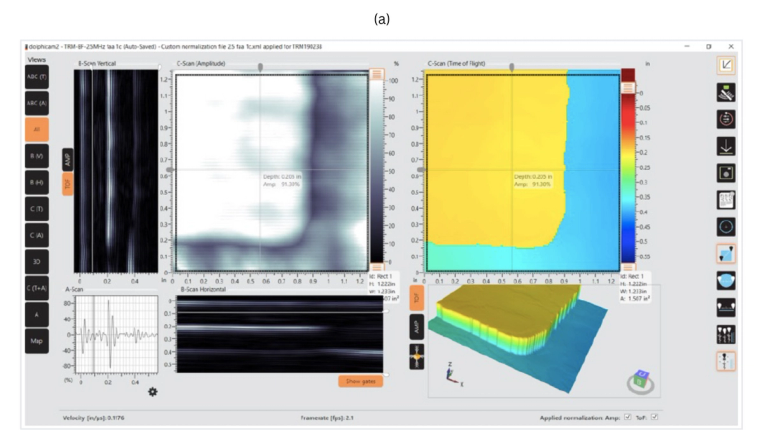
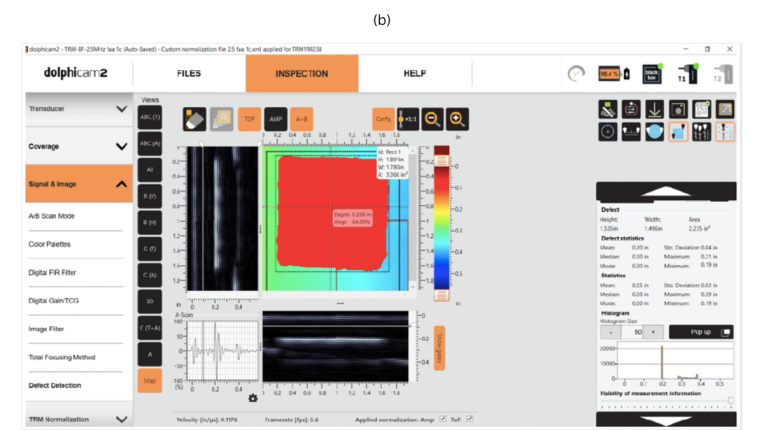
Figure 15. a) All view screenshot of Item #10 a pillow insert embedded at the interface between ply 24 and 25 of the main laminate over the taper. b) The corresponding manually-stitched FMC C-Scan (TOF) of Item #10 with Defect Detection activated.
Figure 16. details Item #11, grease, that is embedded in the taper between ply 1 and ply 2. The green region in TOF view represents Item #11. The dark blue region transitioning to a green is the backwall of the taper. Using dolphitech’s Defect Detection feature in TOF view reveals the flaw encompasses an area of 0.669in².
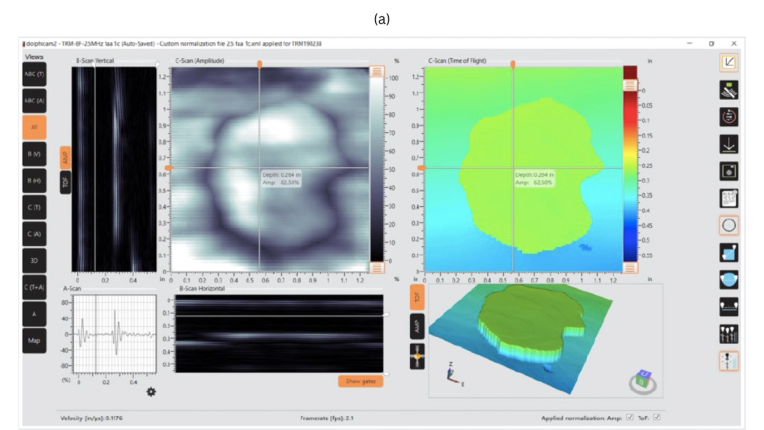
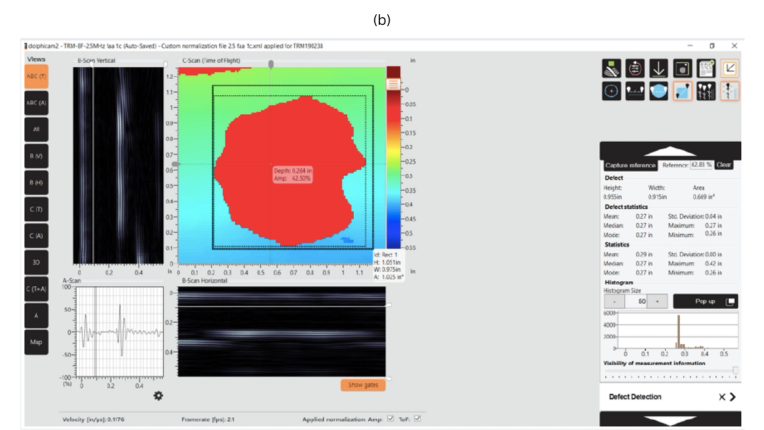
Figure 16. a) All view screenshot of Item #1 grease, which is embedded in the taper between ply 1 and ply 2. b) The corresponding manually-stitched FMC C-Scan (TOF) of Item #11 with Defect Detection activated.
Figure 17. details Item #12, Grafoil, embedded between ply 16 & 17 of the main laminate over the substructure. The orange circle in the TOF View represents Item #12. The green region to the right represents the backwall of the substrate while the dark blue region represents the backwall of the substructure. The light blue region represents Item #5 which was misplaced. Using dolphitech’s Defect Detection feature in TOF view reveals the flaw encompasses an area of 0.861in².
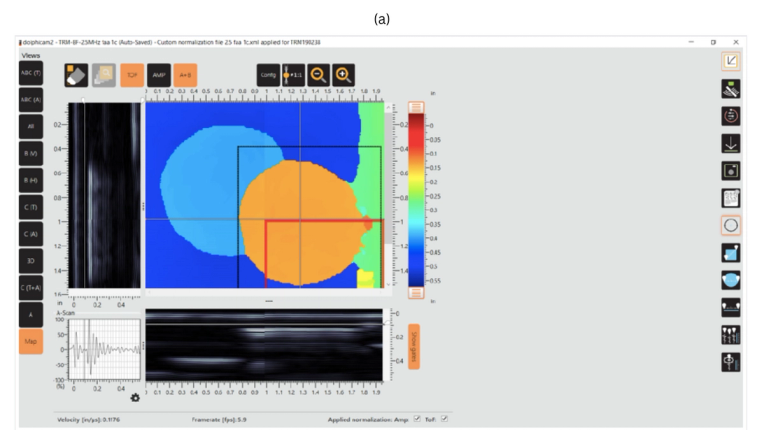

Figure 17. a) Manually-stitched screenshot of Item #12 Grafoil, embedded between ply 16 & 17 of the main laminate. b) The corresponding screenshot with Defect Detection activated.
Figure 18. details Item #13, a Flat Bottom Hole (FBH) machined between ply 16 & 17 (0.120″ ) of the taper. The light blue region in the TOF view represents Item #13. The dark blue region represents the backwall of the taper. Using dolphitech’s Defect Detection feature in TOF view reveals the flaw encompasses an area of 2.068in².
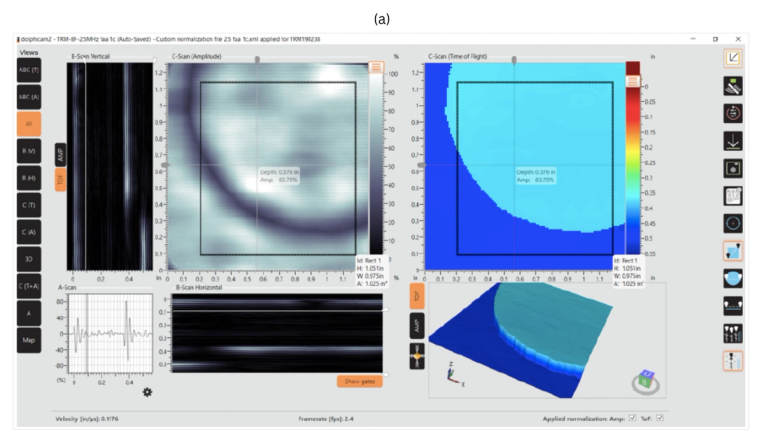

Figure 18. a) All view screenshot of Item #13 an FBH machined between ply 16 & 17 (0.120″ ) of the taper. b) The corresponding manually stitched FMC C-Scan (TOF) of Item #13 with Defect Detection activated.
Figure 19. details Item #14, a FBH machined between ply 48 & 49 (0.360″ ) of the taper. The orange region in the TOF view represents Item #14. The dark blue region represents the backwall of the taper. Using dolphitech’s Defect Detection feature in TOF view reveals the flaw encompasses an area of 0.298in².
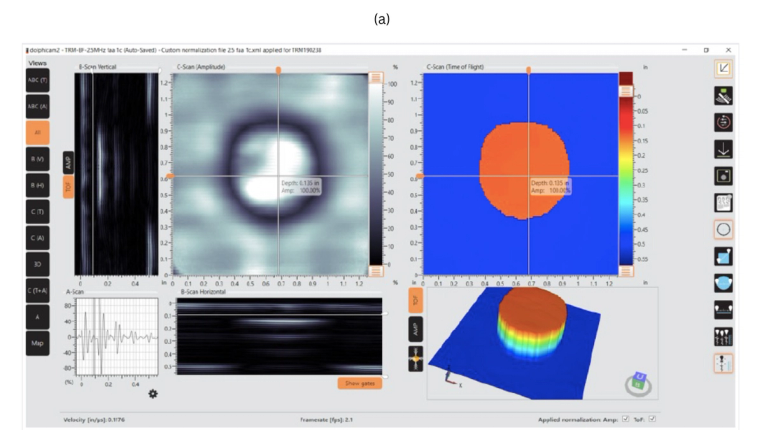
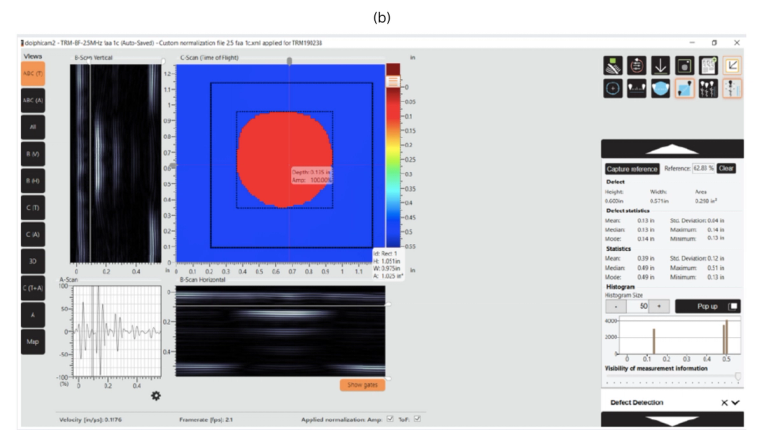
Figure 19. a) All view screenshot of Item #14 an FBH machined between ply 48 & 49 (0.360″ ) of the taper. b) The corresponding C-Scan (TOF) of Item #14 with Defect Detection activated.
Figure 20. details Item #15, a FBH machined between ply 24 & 25 (0.060″ ) of the substructure. The blue region in the TOF view represents Item #15. The dark blue region represents the backwall of the substructure. Using dolphitech’s Defect Detection feature in TOF view reveals the flaw encompasses an area of 0.201in².
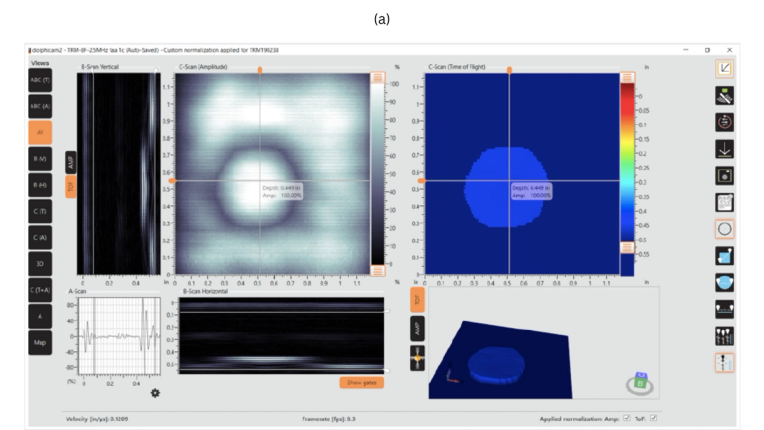

Figure 20. a) All view screenshot of Item #15 an FBH machined between ply 24 & 25 (0.060″ ) of the substructure. b) The corresponding C-Scan (TOF) of Item #15 with Defect Detection activated.
Figures 21. details Item #16, prepreg backing, that was embedded between ply 8 and 9 of the main laminate. The orange regions of the TOF view represent Item #16. The green region represents the backwall of the main laminate. Using dolphitech’s Defect Detection feature in TOF view reveals the flaw encompasses an area of 0.306in²
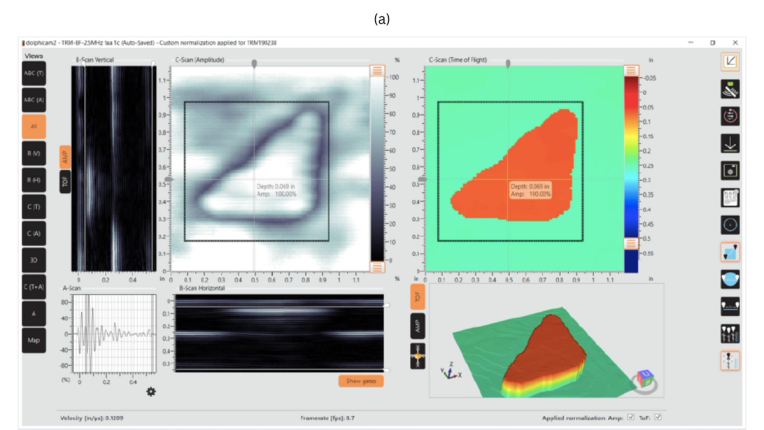
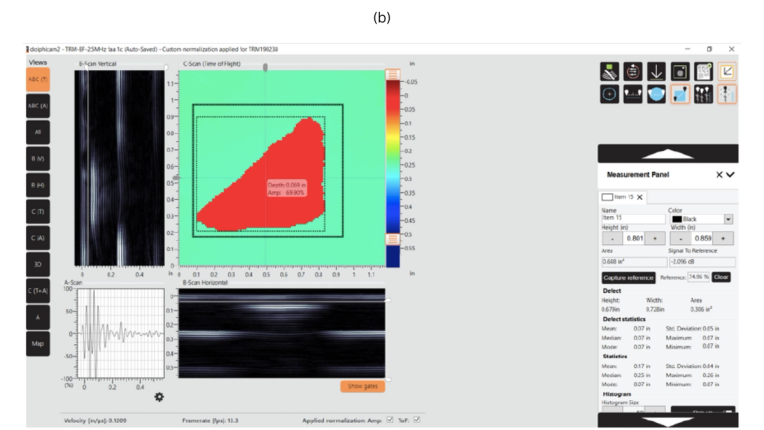
Figure 21. a) All view screenshot of Item #16 prepreg backing, that was embedded between ply 8 and 9 of the main laminate. b) The corresponding C-Scan (TOF) of Item #16 with Defect Detection activated.
Figure 22. details Item #17, prepreg backing, that was embedded between ply 24 and 25 of the main laminate. The dark yellow regions of the TOF view represent Item #17. The green region represents the backwall of the main laminate. Using dolphitech’s Defect Detection feature in TOF view reveals the flaw encompasses an area of 1.593in².
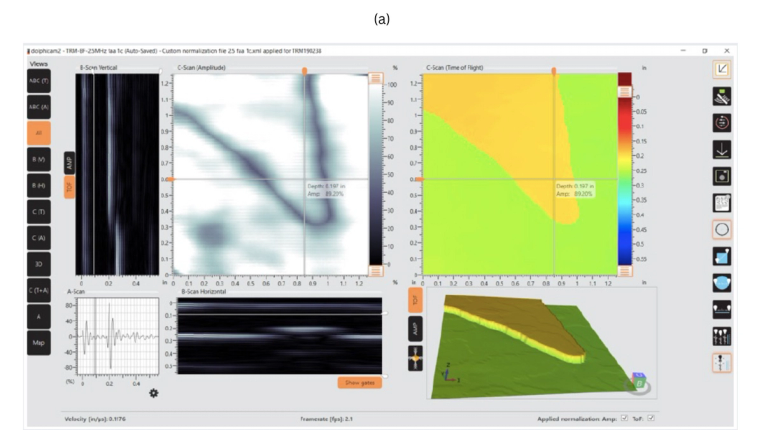
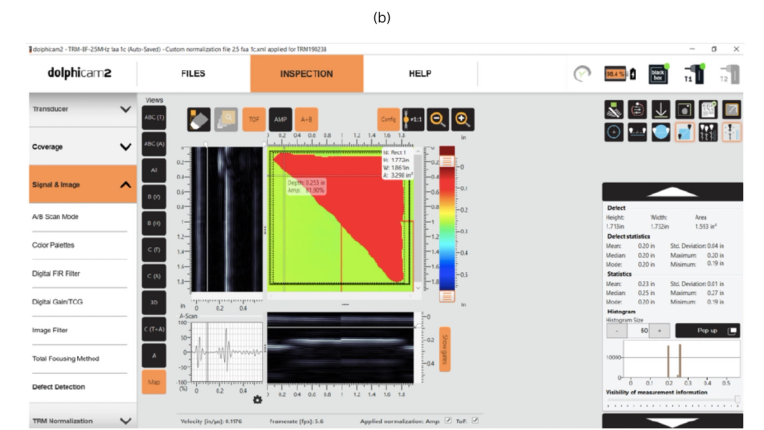
Figure 22. a) All view screenshot of Item #17, prepreg backing, that was embedded between ply 24 and 25 of the main laminate. b) The corresponding manually stitched FMC C-Scan (TOF) of Item #17.
Figures 23. details Item #18, adhesive backing, that was embedded between the adhesive and ply 1 of the substructure. The dark blue regions of the TOF view represent Item #18. The blue region represents the backwall of the substructure. An extra inclusion can be seen within the 32–ply main laminate, seen in the TOF and 3D views as the orange region. Using dolphitech’s Defect Detection feature in TOF view reveals the flaw encompasses an area of 3.734in².
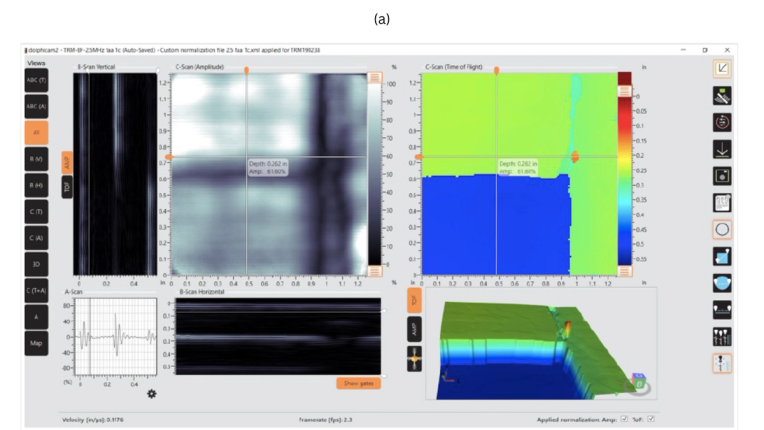

Figure 23. a) All view screenshot of Item #18 adhesive backing, which was embedded between the adhesive and ply 1 of the substructure . b) The corresponding manually-stitched FMC C-scan (TOF) of Item #18 with Defect Detection activated.
Figures 24. details Item #19, a sealant blob, that was smeared on the backside of the 32-ply laminate. The green regions of the TOF View represent Item #19. The dark yellow region represents the backwall of the 32-ply laminate. Measuring the flaw using the line measurement tool shows a reading of 1.004″ along the X-axis and 2.105″ along the Y-axis.

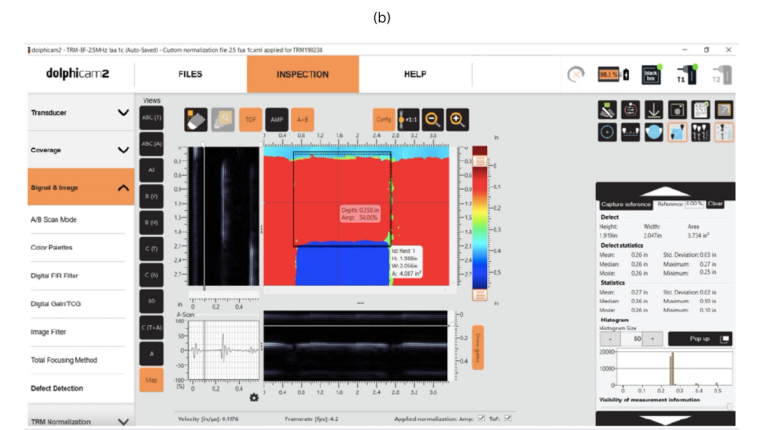
Figure 24. a) All view screenshot of Item #19, a sealant blob on the backside of the 32-ply laminate. b) The corresponding manually-stitched FMC C-scan (AMP) of Item #19.
Figures 25. details Item #20, a sealant blob, that was smeared on the backside of the taper. The dark blue regions of the TOF View represent Item #20. The blue region represents the backwall of the taper. Measuring the flaw using the line measurement tool shows a reading of 2.918″ along the X-axis and 0.903″ along the Y-axis.
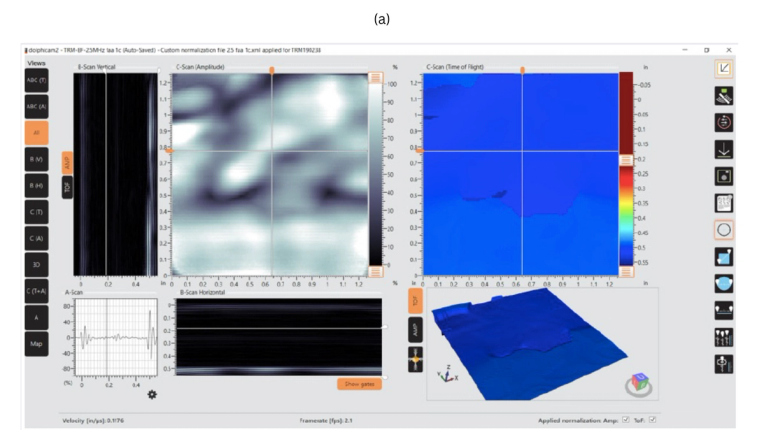
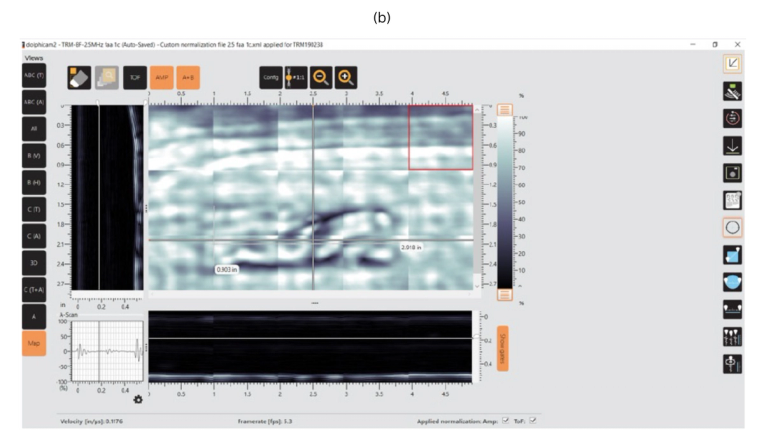
Figure 25. a) All view screenshot of Item #20, a sealant blob, that was smeared on the backside of the taper. b) The corresponding manually-stitched FMC C-scan (TOF) of Item #20.
Figures 26. details Item #21, a grind disk groove on the backside of the main laminate, approx. 0.070″. Due to the curvature of the grind disk groove, the flaw can be seen in the AMP view due to the loss of backwall signal. Using the B-Scan (Horizontal View) the extent of the grind disk groove can be measured. Using dolphitech’s Defect Detection feature in AMP view reveals the flaw encompasses an area of 0.133in².
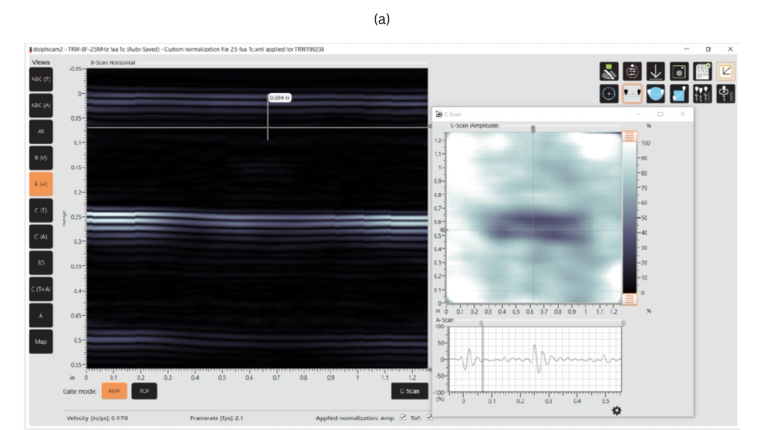
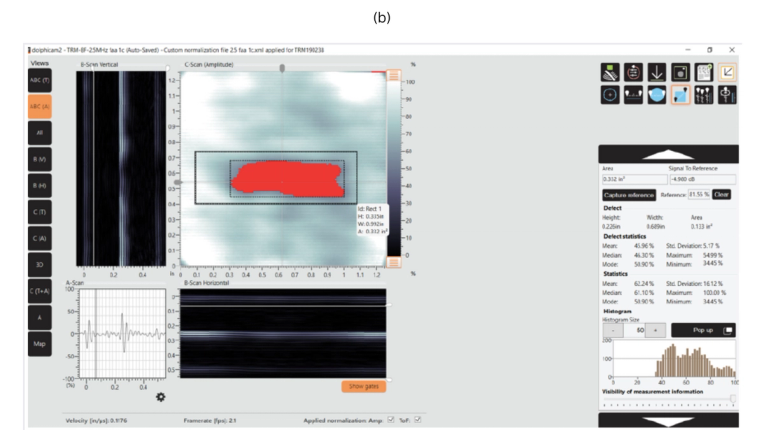
Figure 26. a) Screenshot of B-Scan horizontal view with a C-scan popup for Item #21, a grind disk groove on the backside of the main laminate. b) The corresponding amplitude view screenshot with Defect Detection activated.
With all inserted flaws identified, the dimensional measurements for the flaws on each of the C-scans were compiled to form Table 2. The displayed precision of these values is reflective of the full value from the measurement tool rather than actual precision, where the measurements are only taken roughly. Also, in Table 2, the nominal sizes from Table 1 are repeated to allow them to be compared side-by-side, and the difference between the measured and nominal dimensions are given as a percentage. For items where multiple dimensions are measured, the differences between each of the measured dimensions and their nominal counterpart are calculated then the average of these calculated values is given as the difference. It should be noted that nominal dimensions may not necessarily represent actual dimensions, and as such should not be considered as ground truth values.

CONCLUSION
The dolphicam2+ with a TRM-BF-2.5MHz transducer (TRM) was able to successfully inspect the FAA NDI Proficiency Specimen 1C.
All the manufactured flaws present were clearly resolved and characterized. These flaws are categorized as Carbospheres, pillow inserts, grease, Grafoil, flat bottom holes, prepreg backing, adhesive backing, and sealant. Moreover, the flaws could be sized, and they were found to be in good agreement with nominal dimensions. The time and cost savings enabled by the dolphicam2+ is demonstrated by this ability to characterize such a wide range of flaw types with a single setup in conjunction with dolphitech’s Defect Detection. The TRM-BF-2.5MHz transducer is versatile and well-suited for many aerospace applications featuring moderate to thicker thicknesses of both composites and bonded substructures.
REQUEST A QUOTE OR SUBMIT AN ENQUIRY
Need help with product information?
Get in touch with our experts for information or a quotation.